Visual Displays of Demand and Performance
You will receive many calls into your service, most will make it through to your staff, but many won’t. Knowing where all of your calls come in and what happened to them gives you a full picture of all inbound activity.
Surgery Connect provides intuitive management reporting tools to help manage call volumes and better understand demand.
- Reporting functionality allows analysis of call details such as time taken to answer, areas of highest demand, and call abandonment.
- A user-friendly wallboard gives administration staff real-time call status, enabling them to allocate staff and resources where they are needed most.
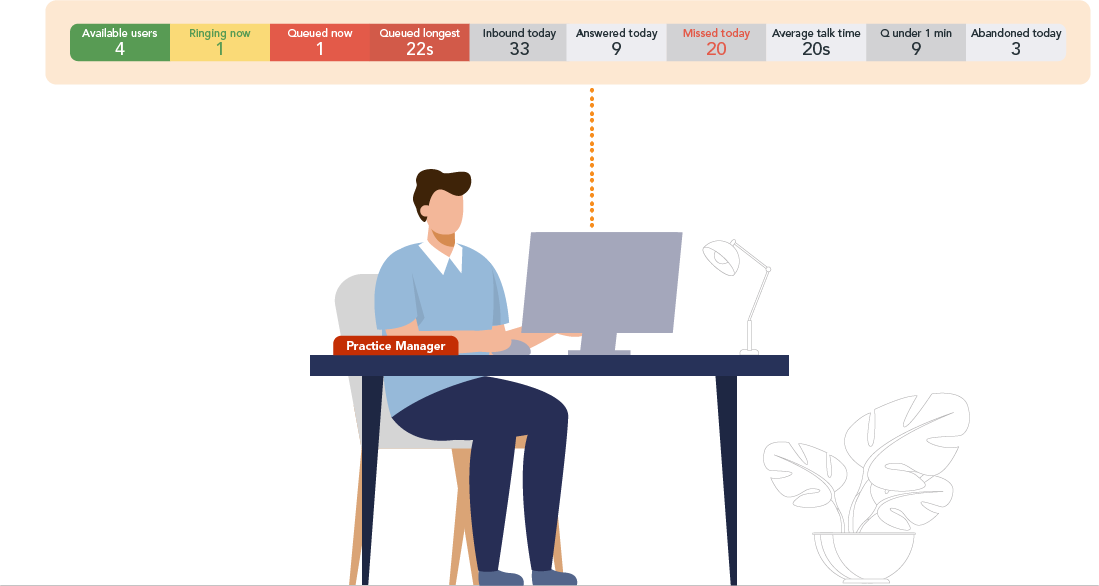
Live Real-time Reporting
Wallboards display the status of your call traffic on a range of plasma screens, computers and smart devices. Call handlers benefit from seeing how they are performing in real-time and the statistics are recorded for reporting.
Reports and wallboards provide essential information including details of abandoned calls, number of calls queued, average answer times, trends and more. With cradle-to-grave call visibility and historic call reporting.


View Statistics
Easily interpreted charts, graphs and call statistics provide important information about calls handled by your practice. Measure performance and plan for busy periods with details of unanswered calls, average answer times, number of calls received and use easy-to-read reports to provide an audit trail.
The call reporting portal is accessed via the internet, using a secure login, so you no longer need to be on-site to make last-minute changes to cater for unplanned changes in events.
Monthly Management Report
Each Surgery Connect customer automatically receives a monthly management report that provides an overview of call and personnel data, valuable information that can help manage call volumes and better understand demand.
- Your call summary
- Which inbound number took the most calls
- Which users answered and made the most calls
- Which days of the week/times of day were busiest for queued calls
- When are the most outbound calls made
- Average in and outbound call lengths
- An average of how many queued calls are answered by day of the week
- Menu choices (if applicable)
- Monthly Summary

Looking for Support with Surgery Connect Reports?
Transform your Communications with Surgery Connect
