
The NHS England 2026/27 GP contract introduces clearer requirements for practices to measure demand, report on performance and improve patient access over time.
These changes are directionally right. But they assume a level of operational visibility that many practices do not yet have.
NHS England has been explicit about this direction. Practice-level data on access and demand will be collected and used to inform oversight and support. In simple terms, access is becoming visible beyond the practice itself.
As that visibility increases, differences in how access is delivered will become clearer — between clinicians, days of the week and neighbouring practices. Patterns such as longer wait times, slower responses, or uneven demand handling will be easier to identify. That has implications not just for day-to-day operations, but for how performance is understood and reviewed.
At the same time, expectations around responsiveness have been tightened. Clinically urgent requests must be handled on the same day, while all other requests require a defined response by the end of the next working day.
The challenge is that these expectations assume something many practices still lack: a clear, joined-up view of what is actually happening across access channels.
Why most practices struggle to improve patient access
Better NHS patient access starts at general practice, but for many teams, access is still experienced in fragments rather than understood as a system.
At 8am, call queues spike. By 8:20, patients are hanging up. By mid-morning, reception teams are managing backlog rather than flow. Online consultations surge after weekends, but without a clear view of how that demand interacts with phone access or appointment capacity.
These are lived moments, not measured patterns.
There are still persistent gaps:
- Demand patterns are not consistently tracked over time
- It is hard to compare how patients move between phone and digital channels
- Metrics like wait times or response times are rarely visible in one place
The issue is not that practices lack data. It is that the data they have does not reflect how access actually behaves across channels.
This becomes more challenging under the new GP contract rules. Practices can no longer rely on limiting demand to cope. Patients should not be asked to call back another day, and online consultation systems cannot be capped during core hours.
That means demand is not only increasing in volume, but practices are also becoming more exposed. This quickly turns into questions: why response times vary, why some channels absorb pressure while others collapse. All of which directly impact efforts to improve patient access.
Why data matters to improve patient access
The impact of limited visibility is not theoretical. It shows up in day-to-day operations.
Staffing becomes reactive. Rotas are based on what felt busy last week, rather than what demand actually looks like over time. That leads to potential overstaffing in quieter periods and pressure during predictable peaks.
Proving compliance also becomes harder. If access reporting is required, practices need consistent data that shows how demand is handled and how performance is changing.
Most importantly, it limits progress. If you cannot see where pressure starts, it is difficult to fix it. Bottlenecks are managed in the moment, but rarely addressed at the source. This is where many teams find themselves working hard to keep up, but without the insight needed to get ahead and improve patient access in a consistent way.
Better use of GP practice data can unlock operational efficiency, helping teams move towards more planned, sustainable ways of working.
How better insight helps improve patient access
Collecting data is only part of the answer. The real value comes from understanding it.
Basic reporting might tell you how many calls were received or how many online requests were submitted. But it does not explain how access is performing as a whole.
Real insight goes further, connecting different parts of the access journey and showing how they relate to each other.
For example, looking at call wait times alongside online consultation usage can show whether patients are switching channels when one becomes too slow. Tracking demand across the week can reveal predictable pressure points that are invisible day to day.
Over time, this builds a clearer picture:
- When demand consistently rises
- How patients choose to get in touch
- Why patients choose to get in touch
- Where delays start to appear
This is where many practices start to see a shift in understanding. The problem is often not total demand, but how that demand is distributed, delayed, or hidden hidden — insights that are key to improve patient access effectively.
This is also where newer reporting approaches are starting to add value. It is no longer just about front-door demand. Understanding what happens inside the consultation matters too.
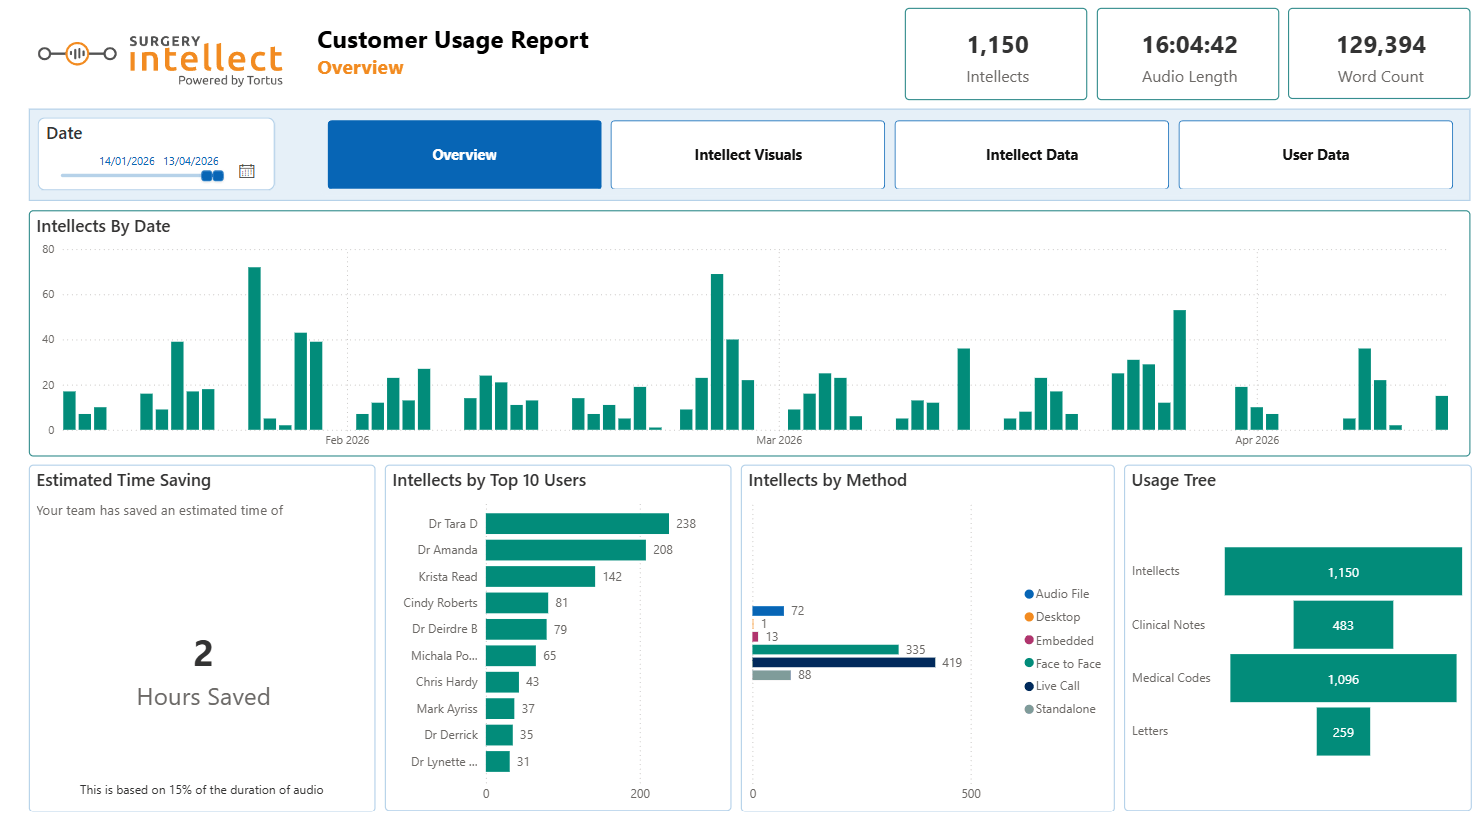
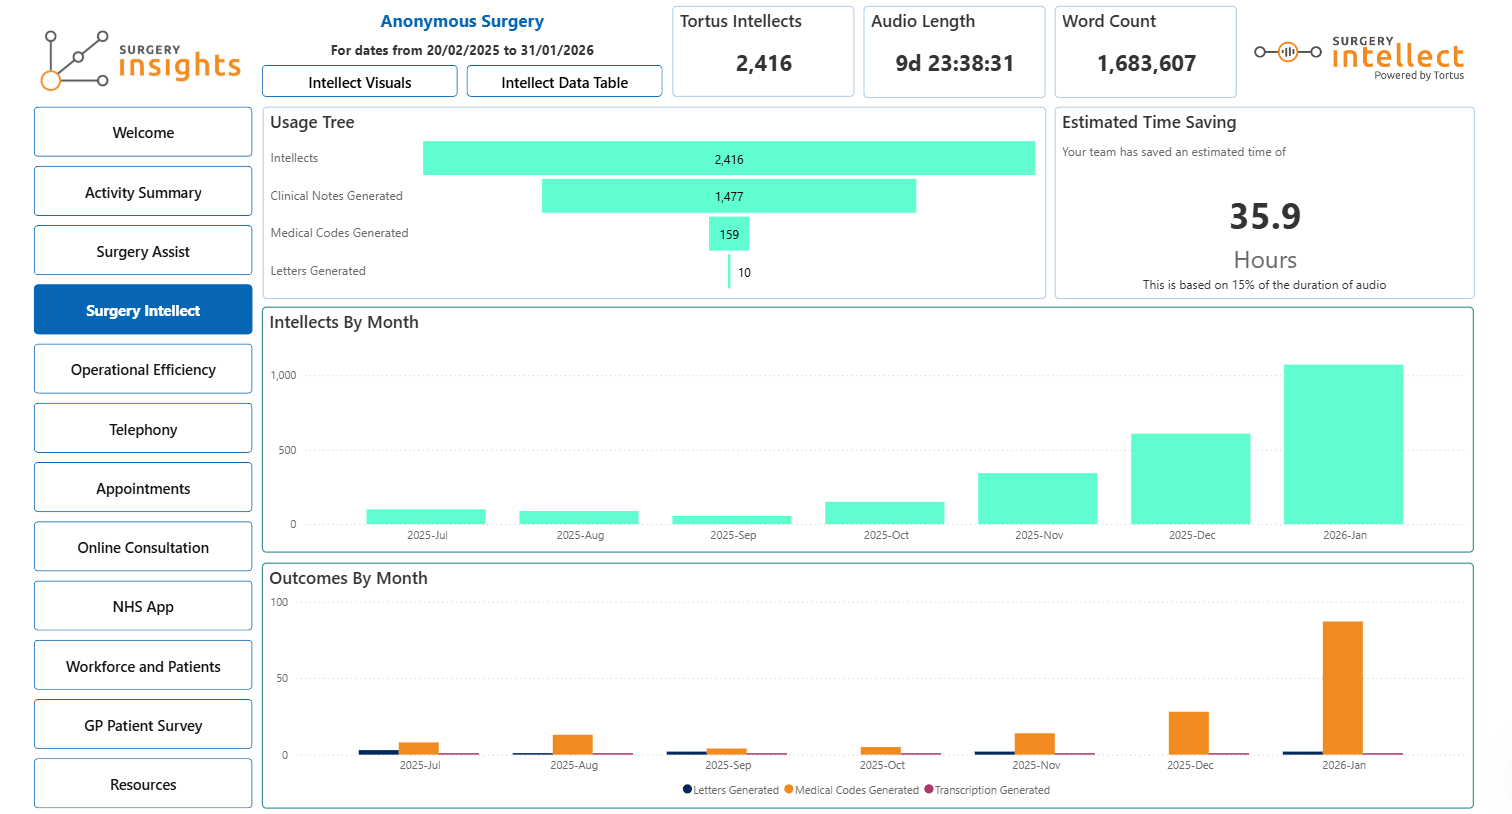
For example, Surgery Intellect reports give practices a detailed view of how clinical documentation is being handled across the team. They show when consultations are happening, how they are being captured, and how much time is being saved through automation.
This creates a more complete picture. Not just how many patients are getting through the door, but how efficiently they are being managed once they are seen. This supports efforts to improve patient access without adding pressure to clinicians.
Related read: NHS England telephony data: How clean data supports access
Creating a clearer view to improve patient access
The shift is not towards more dashboards. It is towards a single, shared view of access. When telephony, online consultations, and appointment activity are brought together, access starts to behave like a system rather than a set of disconnected channels.
Tools such as the Surgery Insights dashboard are designed to support this by combining these data sources into one operational view. This allows practices to see call wait times, missed calls, and callback performance alongside online consultation volumes and appointment activity. It also introduces benchmarking, helping teams understand how their access performance compares with national patterns and not just their own internal baseline. This is a key step to improve patient access in a measurable way.
This makes it easier to connect demand with capacity. When workload trends are viewed alongside staffing levels, practices can start to see whether peaks in demand are being matched by available resource, or where pressure is building over time.
Using access intelligence to improve patient access
This is where the idea of access intelligence becomes more relevant. It is not just about reporting activity for the sake of compliance. It is about using that data to guide decisions at every level, and responding to what that data reveals.
At a practice level, it supports better planning. Teams can align staffing with real demand rather than assumption, and adjust workflows based on how patients interact with services to improve patient access more reliably. At a PCN level, it introduces comparison. Variation between practices becomes visible and with it, the opportunity to understand what is driving different outcomes. At an ICB level, it provides a system-wide view of access. That brings benefits for planning and resource allocation, but also increases visibility of variation and performance.
In each case, the goal is the same: move from reactive management to informed decision-making.
To improve patient access, the focus has often been on capacity: more appointments, more staff, more availability. Those things matter, but are only part of the picture. If pressure points remain hidden, adding capacity does not resolve the underlying issue. It simply shifts it from phones to online, from mornings to afternoons, from one team to another. The GP contract change brings this into focus. By requiring better reporting, it removes some of the ambiguity around access.
But visibility alone does not solve the problem. It exposes it. The challenge is to turn that data into something useful.
Because once you can see access clearly, you can start to shape it.
Want to turn access data into action?