

NHS England recorded 33.9 million appointments in general practice in July 2026, around 4% higher than July last year.
The figures show the scale of activity taking place before winter. They also show the pace at which practices are responding to patient need. Almost half of appointments took place on the day they were booked. For clinically urgent appointments, this rose to 77%.
That sounds like a positive picture of access. And it may be. But GP appointment data cannot tell us whether a patient reached that same-day appointment through one straightforward interaction, or after waiting on the phone, trying several times to get through and submitting an online request.
Appointment numbers alone do not explain how patients experienced access, where pressure built up or how much effort was required from patients and staff to reach an outcome.
For practice managers and clinical leaders, the value of data lies in using it to make better operational decisions. This means looking beyond how many appointments took place and asking what happened before, during and after a patient contacted the practice.
What the latest GP appointment data shows
The July data covers 98.9% of GP practices in England and records activity from GP practice and Primary Care Network appointment systems.
Key findings include:
- 33.9 million appointments were recorded in GP practice appointment books
- 44.7% took place on the same day they were booked
- 6.7 million appointments were recorded as clinically urgent
- 77% of clinically urgent appointments were dealt with on the same day
- 58.1% of non-clinically urgent appointments took place within seven days
- 89.5% of appointments were attended
- 43.8% of appointments were carried out by a GP and 18.5% by nurses
- 60.1% took place face-to-face
These measures provide a useful national picture of appointment activity. They help show the volume of care general practice delivers and the different roles involved in meeting demand.
Yet they are only one part of the picture.
NHS England is clear that the publication does not show all general practice workload. It only includes activity captured in participating appointment systems and does not assess the complexity of that activity.
An appointment is the outcome of many steps. Patients may have called, submitted an online request, used the NHS App, spoken to reception, received an SMS or been directed to another service before it was booked.
GP appointment data tells us about an important outcome. It does not tell us the operational effort required to get there. Understanding those steps is essential when reviewing access.
GP appointment data does not show the full patient journey
National data shows how many appointments took place. To understand what sits behind those figures, practices need to bring together data from across their access routes.
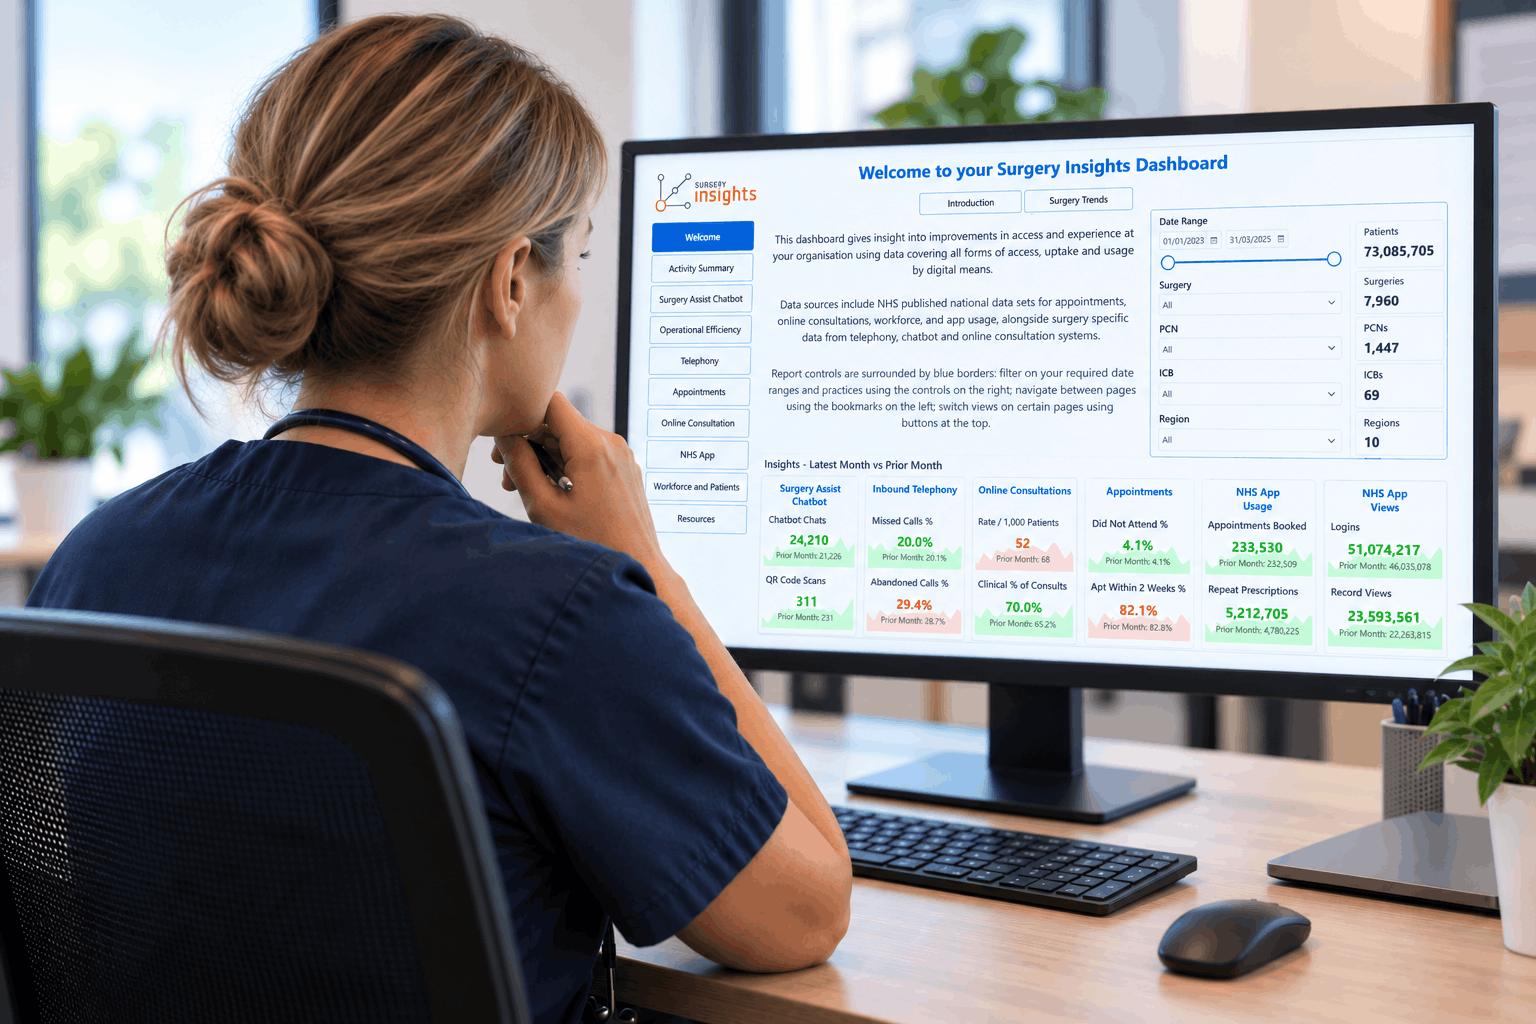
Centralised dashboards can provide this joined up view. For example, Surgery Insights combines telephony, online consultation, digital assistant, NHS App and GP appointment data in one dashboard. It helps teams move beyond a single monthly total to see where demand is coming from, when it peaks and how patients are using different routes into care.
For example, imagine a practice where same-day appointment performance remains strong, but call abandonment rises sharply between 8am and 10am while online requests increase at the same time.
The GP appointment data alone may not suggest an obvious access problem. Looking across those different routes could reveal that the practice is achieving a good clinical outcome while patients and reception teams are absorbing significant friction before the appointment is booked.
A practice can review call volumes and abandoned calls alongside online request volumes, appointments booked through connected routes and NHS App activity. It can also track callbacks requested through Surgery Assist, patient questions asked of the digital assistant and how many calls were avoided after an SMS.
This makes it easier to identify whether a change has genuinely reduced pressure or simply moved it elsewhere.
A same-day appointment can be a positive outcome. It may mean a patient received timely care when they needed it. However, it does not show how straightforward their journey was. A patient may have waited on the phone, tried several times to get through or submitted an online request before being offered that appointment. This is why patient access pathways need a safety net, so people can still reach appropriate care when their first route does not work.
Equally, a lower number of appointments does not necessarily mean poorer access, just as a higher number does not automatically mean better access.
Patients may have been directed appropriately to self-care, a pharmacy, community services or a different practice pathway. That may be the right outcome, but teams need to understand whether patients received clear guidance and whether their demand was resolved rather than simply moved elsewhere.
Turn GP appointment data into operational decisions
The question is not simply whether appointment numbers are high or low. It is whether the data shows a pattern that a practice can act on. For example, reviewing NHS England telephony data alongside appointment activity can help teams to understand how queues, abandoned calls and appointment demand are connected.
Surgery Insights supports this by showing performance against national averages or relevant targets, rather than only comparing results with the previous month. Teams can filter data by period, practice, PCN, ICB or Sub-ICB to understand local variation and benchmark performance more clearly.
It can help answer practical questions, such as:
- When are phone queues and online requests at their busiest?
- Which types of request are creating the most contact?
- Are patients using the NHS App and other digital routes?
- Are requests being resolved through Surgery Assist, or leading to further contact?
- How much administrative time is being saved through AI-supported tools?
- Are patients booking, cancelling or requesting callbacks through connected access routes?
The dashboard also tracks operational efficiency in hours, including time saved through tools including Surgery Intellect, powered by TORTUS, and Omni Consultations. This gives practice teams a clearer way to measure whether new tools are reducing administrative workload.
This connected view matters because you can’t improve patient access if you can’t see it. Taken together, these measures can point towards a practical change. A practice may adjust staffing around its busiest periods, refine a call flow, make routine information easier to find or review whether a new pathway is delivering the intended result.
Prepare for Winter with a connected view of demand
July’s data is a reminder of the volume general practice manages every day. As the Winter pressures approach, practices need more than a count of completed appointments. They need to understand where demand starts, how it moves through the practice and where patients or staff face unnecessary friction.
By combining national benchmarks with local access and workflow data, teams can identify where to focus before seasonal pressure increases.
And that may reveal something GP appointment data alone cannot: a practice can have healthy appointment figures while patients and staff are still working too hard to achieve them.
If your appointment numbers look healthy, would you know whether that was happening in your practice?
Explore how you can better understand the journey behind GP appointment data and turn access insight into clearer decisions.